ESP32: JTAG debugging with OpenOCD and a logic probe
Stop guessing why the firmware crashes. Set breakpoints, step through code, inspect registers, with JTAG + OpenOCD + GDB. The right tool when print debugging fails.
I had a firmware crash that took me three weeks to find. The backtrace was useless because the crash happened inside an ISR. Serial.print inside the ISR was not an option (the UART itself was what was crashing). Disabling interrupts made the crash go away, which told me nothing useful. Logic analyzer showed the GPIO state at the time of the crash but not why.
JTAG solved it in an afternoon. I set a hardware breakpoint at the
start of the ISR, single-stepped through it, and watched the
registers. A buffer pointer had wrapped around and the write
that crashed was to address 0x00000000 because of an unsigned
overflow. Three weeks of guessing, one afternoon of stepping.
JTAG is overkill for most debugging. When you need it, you need it badly. This tutorial is the setup I use.
What JTAG is
JTAG is a hardware debug interface built into most microcontrollers. It lets an external probe:
- Halt the CPU at any instruction
- Set breakpoints (hardware, not software)
- Read and write CPU registers
- Read and write memory (flash and RAM)
- Single-step through code one instruction at a time
- Resume execution
The CPU runs normally until the probe halts it. No code changes, no software hooks, no instrumented binaries. The probe talks to a dedicated hardware debug block on the chip over a 4-wire (or 2- wire for ESP32-S2/C3/S3) interface.
The catch: you need a hardware probe, a piece of software (OpenOCD) that knows how to talk to the probe and the chip, and a debugger (GDB) that talks to OpenOCD. The setup is fiddly. The reward is that you can debug anything that runs on the chip, with full visibility into the state at the moment of a crash.
Hardware probes
ESP-Prog ($15 from Espressif’s store):
The official Espressif probe. Built specifically for ESP32 JTAG. USB-C, on-board 3.3V regulator so you can power a small board from it, JTAG and serial over the same USB cable. The right pick for ESP32 specifically.
J-Link EDU Mini ($20 from Segger):
The J-Link is the gold standard for ARM debugging. The EDU Mini is the cheap educational version (no commercial use allowed per the license). Works with every ARM chip, including the ESP32-S2/S3/C3 family. Faster than ESP-Prog.
J-Link BASE ($400): the full version. Faster, more features, no usage restrictions. Not worth it for hobby work.
CMSIS-DAP probes ($10-30):
The CMSIS-DAP standard works with any ARM chip. Cheap clones on AliExpress. The interface is slower than J-Link but the price is right. Pick one if you are doing ESP32-S3/C3 work and want one probe for all your ARM boards.
FTDI FT2232H ($20 chip, $40 board):
Some FT2232H-based boards (like the CJMCU-2232HL) support JTAG. Older ESP32 boards (the original DevKit v1) used this pattern. Works fine but requires more wiring than the dedicated probes.
For most people starting JTAG on ESP32, the ESP-Prog is the right pick. It is designed for this exact chip, costs $15, and the JTAG
- serial on one cable is genuinely convenient.
Wiring the JTAG pins
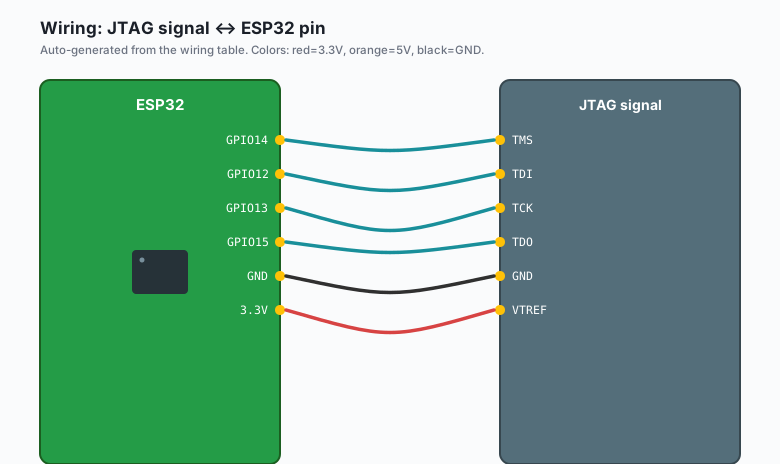
The classic ESP32 JTAG pins are:
| ESP32 pin | JTAG signal |
|---|---|
GPIO14 | TMS |
GPIO12 | TDI |
GPIO13 | TCK |
GPIO15 | TDO |
GND | GND |
3.3V | VTREF |
These are the default JTAG pins for the ESP32-WROOM-32 and most original ESP32 modules. The ESP32-S2, S3, and C3 use different pins (and a 2-wire “cJTAG” interface instead of the 4-wire JTAG). Always check the datasheet for the specific chip you have.
You also need to make sure these pins are not being used by your
firmware. If your code initializes GPIO12 as a GPIO, the JTAG
won’t work. The fix is either to not touch those pins in your
firmware, or to add espefuse.py set_flash_voltage 3.3 style
configuration that makes them JTAG-only at boot.
OpenOCD setup
OpenOCD is the open-source piece that talks to the probe on one side and GDB on the other. You need:
- The OpenOCD binary (the Espressif fork, not the upstream one, because the ESP32 support is in the Espressif fork).
- A config file that describes your probe + chip.
Install OpenOCD. The Arduino ESP32 board package includes a copy on most platforms. The path is something like:
~/.arduino15/packages/esp32/tools/openocd-esp32/v0.12.0-esp32-20240318/openocd-esp32/bin/openocdAdd that to your PATH. Then run:
openocd -f interface/esp-prog.cfg -f target/esp32.cfgFor a J-Link, replace interface/esp-prog.cfg with
interface/jlink.cfg. For a CMSIS-DAP probe, use
interface/cmsis-dap.cfg. The target file is the same.
OpenOCD starts a GDB server on port 3333 and a telnet interface on port 4444. Leave it running in a terminal. You will connect to it from a separate GDB session.
GDB integration with the Arduino IDE
The Arduino IDE does not have native GDB integration. You have two options:
-
Plain GDB in a terminal. Run
xtensa-esp32-elf-gdb firmware.elf(the ELF file is what the Arduino IDE produces in the build output directory). Connect withtarget remote localhost:3333. Set breakpoints, step, inspect. -
VS Code + PlatformIO. PlatformIO has built-in GDB integration. Add
debug_tool = esp-prog(orjlink,cmsis-dap) toplatformio.ini, click the debug button, and VS Code manages the OpenOCD + GDB session. This is what I use daily. -
CLion + PlatformIO. Same as VS Code but with the JetBrains IDE. Better code navigation, worse startup time.
For this tutorial I will use plain GDB because it is the lowest common denominator. The same commands work from any IDE.
Setting breakpoints
Find the ELF file the Arduino IDE produced. It is in the build
output directory; in recent Arduino IDEs, the path is something
like ~/Arduino/build/<sketch_name>/<sketch_name>.ino.elf.
xtensa-esp32-elf-gdb sketch.ino.elf

(gdb) target remote localhost:3333
(gdb) monitor reset halt

# Set a breakpoint at the start of loop()
(gdb) break loop

# Or at a specific line in a specific file
(gdb) break src/main.cpp:42

# Or at the address of an ISR (useful for the original bug I mentioned)
(gdb) break gpio_isr_handler

# Start the program
(gdb) continue
When the breakpoint hits, GDB stops. You can:
print variable_nameto read a variable’s valueinfo localsto see all locals in the current frameinfo registersto see all CPU registersbacktraceto see the call stackstepto execute one source line, stepping into function callsnextto execute one source line, stepping over function callscontinueto resume until the next breakpoint
The combination of step and next is the heart of debugging.
step goes into the function you are calling. next runs the
function without entering it. Use next to fly past library code
and step to dig into your own.
Inspecting memory and registers
The most useful GDB commands for embedded debugging:
info registers: all CPU registers.pcis the program counter,spis the stack pointer,a0-a15are the general purpose registers.x/16x 0x3FF00000: dump 16 words of memory at address0x3FF00000. Use this to inspect data structures, peripheral registers, or raw memory.x/16x $sp: dump 16 words starting at the stack pointer. This is the raw stack contents, useful when you suspect a stack overflow.set var x = 5: change the value of variablex. You can patch state at runtime.set {int}0x3FF00000 = 42: write to a specific memory address. Useful for poking peripheral registers directly.
For ESP32 specifically, the address 0x3FF00000 is the start of
the data RAM region, 0x3F400000 is the start of the peripheral
register region, and 0x400D0000 is the start of the flash
mapping. The exact ranges are in the ESP32 TRM (Technical
Reference Manual), chapter 1.
The case where JTAG is necessary vs print debugging
Print debugging wins when:
- The bug is a logic error, not a crash
- The variables you need to inspect are easy to print
- The timing is not tight (printing inside the ISR is the bug)
- You can reproduce the bug consistently
JTAG wins when:
- The firmware crashes and you need the state at the moment of the crash
- The bug is timing-related and printing changes the timing
- The bug is in an ISR or a callback that runs in interrupt context
- You need to inspect hardware registers, peripheral state, or DMA buffers
- You want to set a hardware breakpoint at an exact instruction and catch a rare event (e.g. “only fires when the WiFi reconnects after a 30-second timeout”)
A rule of thumb: try print debugging for 30 minutes. If you have not made progress, set up JTAG. The setup takes longer than the first debugging session, but every session after that is faster.
A real workflow (the crash from the introduction)
To find the buffer-overflow bug from my introduction:
- Connect ESP-Prog. Wire TMS/TDI/TCK/TDO + GND.
- Start OpenOCD. Connect GDB. Reset the target.
break gpio_isr_handlerto break at the start of the ISR.continue. Toggle the input pin to trigger the ISR.- GDB stops.
info registers. Look ata2(the second argument register, which holds the buffer pointer in the Xtensa calling convention). print/x $a2to see the address in hex. Notice it is0x00000000. That is the crash.backtrace. See who called the ISR with that pointer.- The caller is a queue handler. Step back through it. Find the line where the pointer was supposed to be set. Find the arithmetic bug that wrapped it.
What would have taken days with print debugging was 20 minutes with JTAG. Setup time was 2 hours (one time, the first time).
Common gotchas
- The ESP32 is using JTAG pins as GPIO. Make sure your firmware does not initialize GPIO12-15.
- OpenOCD cannot connect. Check the wiring. Check that the ESP32 is powered (some probes do not supply enough current through VTREF). Try a different USB cable.
- GDB says “remote replied unexpectedly”. You forgot to start OpenOCD, or OpenOCD is on a different machine than GDB. They have to be on the same machine or the network has to allow port 3333.
- Breakpoints do not trigger. The code might have been
optimized out. Build with
-Og(debug optimization) instead of-Os(size optimization) so the compiler keeps the lines you set breakpoints on. - GDB shows the wrong source line. The source file was edited after the ELF was built. Rebuild the ELF and reconnect.
What to build next
- A test sketch with a deliberate bug (null pointer dereference, buffer overflow, infinite loop). Set a breakpoint, find it.
- The same bug without JTAG, using only Serial.print. Notice how much longer it takes.
- An ESP32-S3 project that uses the built-in USB-JTAG (no external probe needed). The S2/S3/C3 have USB-JTAG on the native USB port; the wiring is just a USB cable.
- VS Code + PlatformIO if you are not already using it. The IDE integration makes JTAG debugging a one-click operation.